- Tutorial
- Audience Research
- HN Analysis
6 Steps for Building an Audience Map for Channel Expansion
A practical walkthrough for digital, growth, and performance marketers who want to know whether Hacker News is worth their time and spend (before they spend).
Why I built this
I was doing channel research on a target company that mentioned Reddit as a place they were exploring. I wanted to understand which competitors (direct and indirect) share an audience, and the engagement volume.
Thanks to Reddit's 2023+ API restrictions, I had to abandon the idea since I did not have enterprise access. So I pivoted to the closest high-signal channel for a technical, infrastructure buying audience: Hacker News. HN has an open Algolia-backed API and the kind of audience that maps cleanly to a B2B buyer journey.
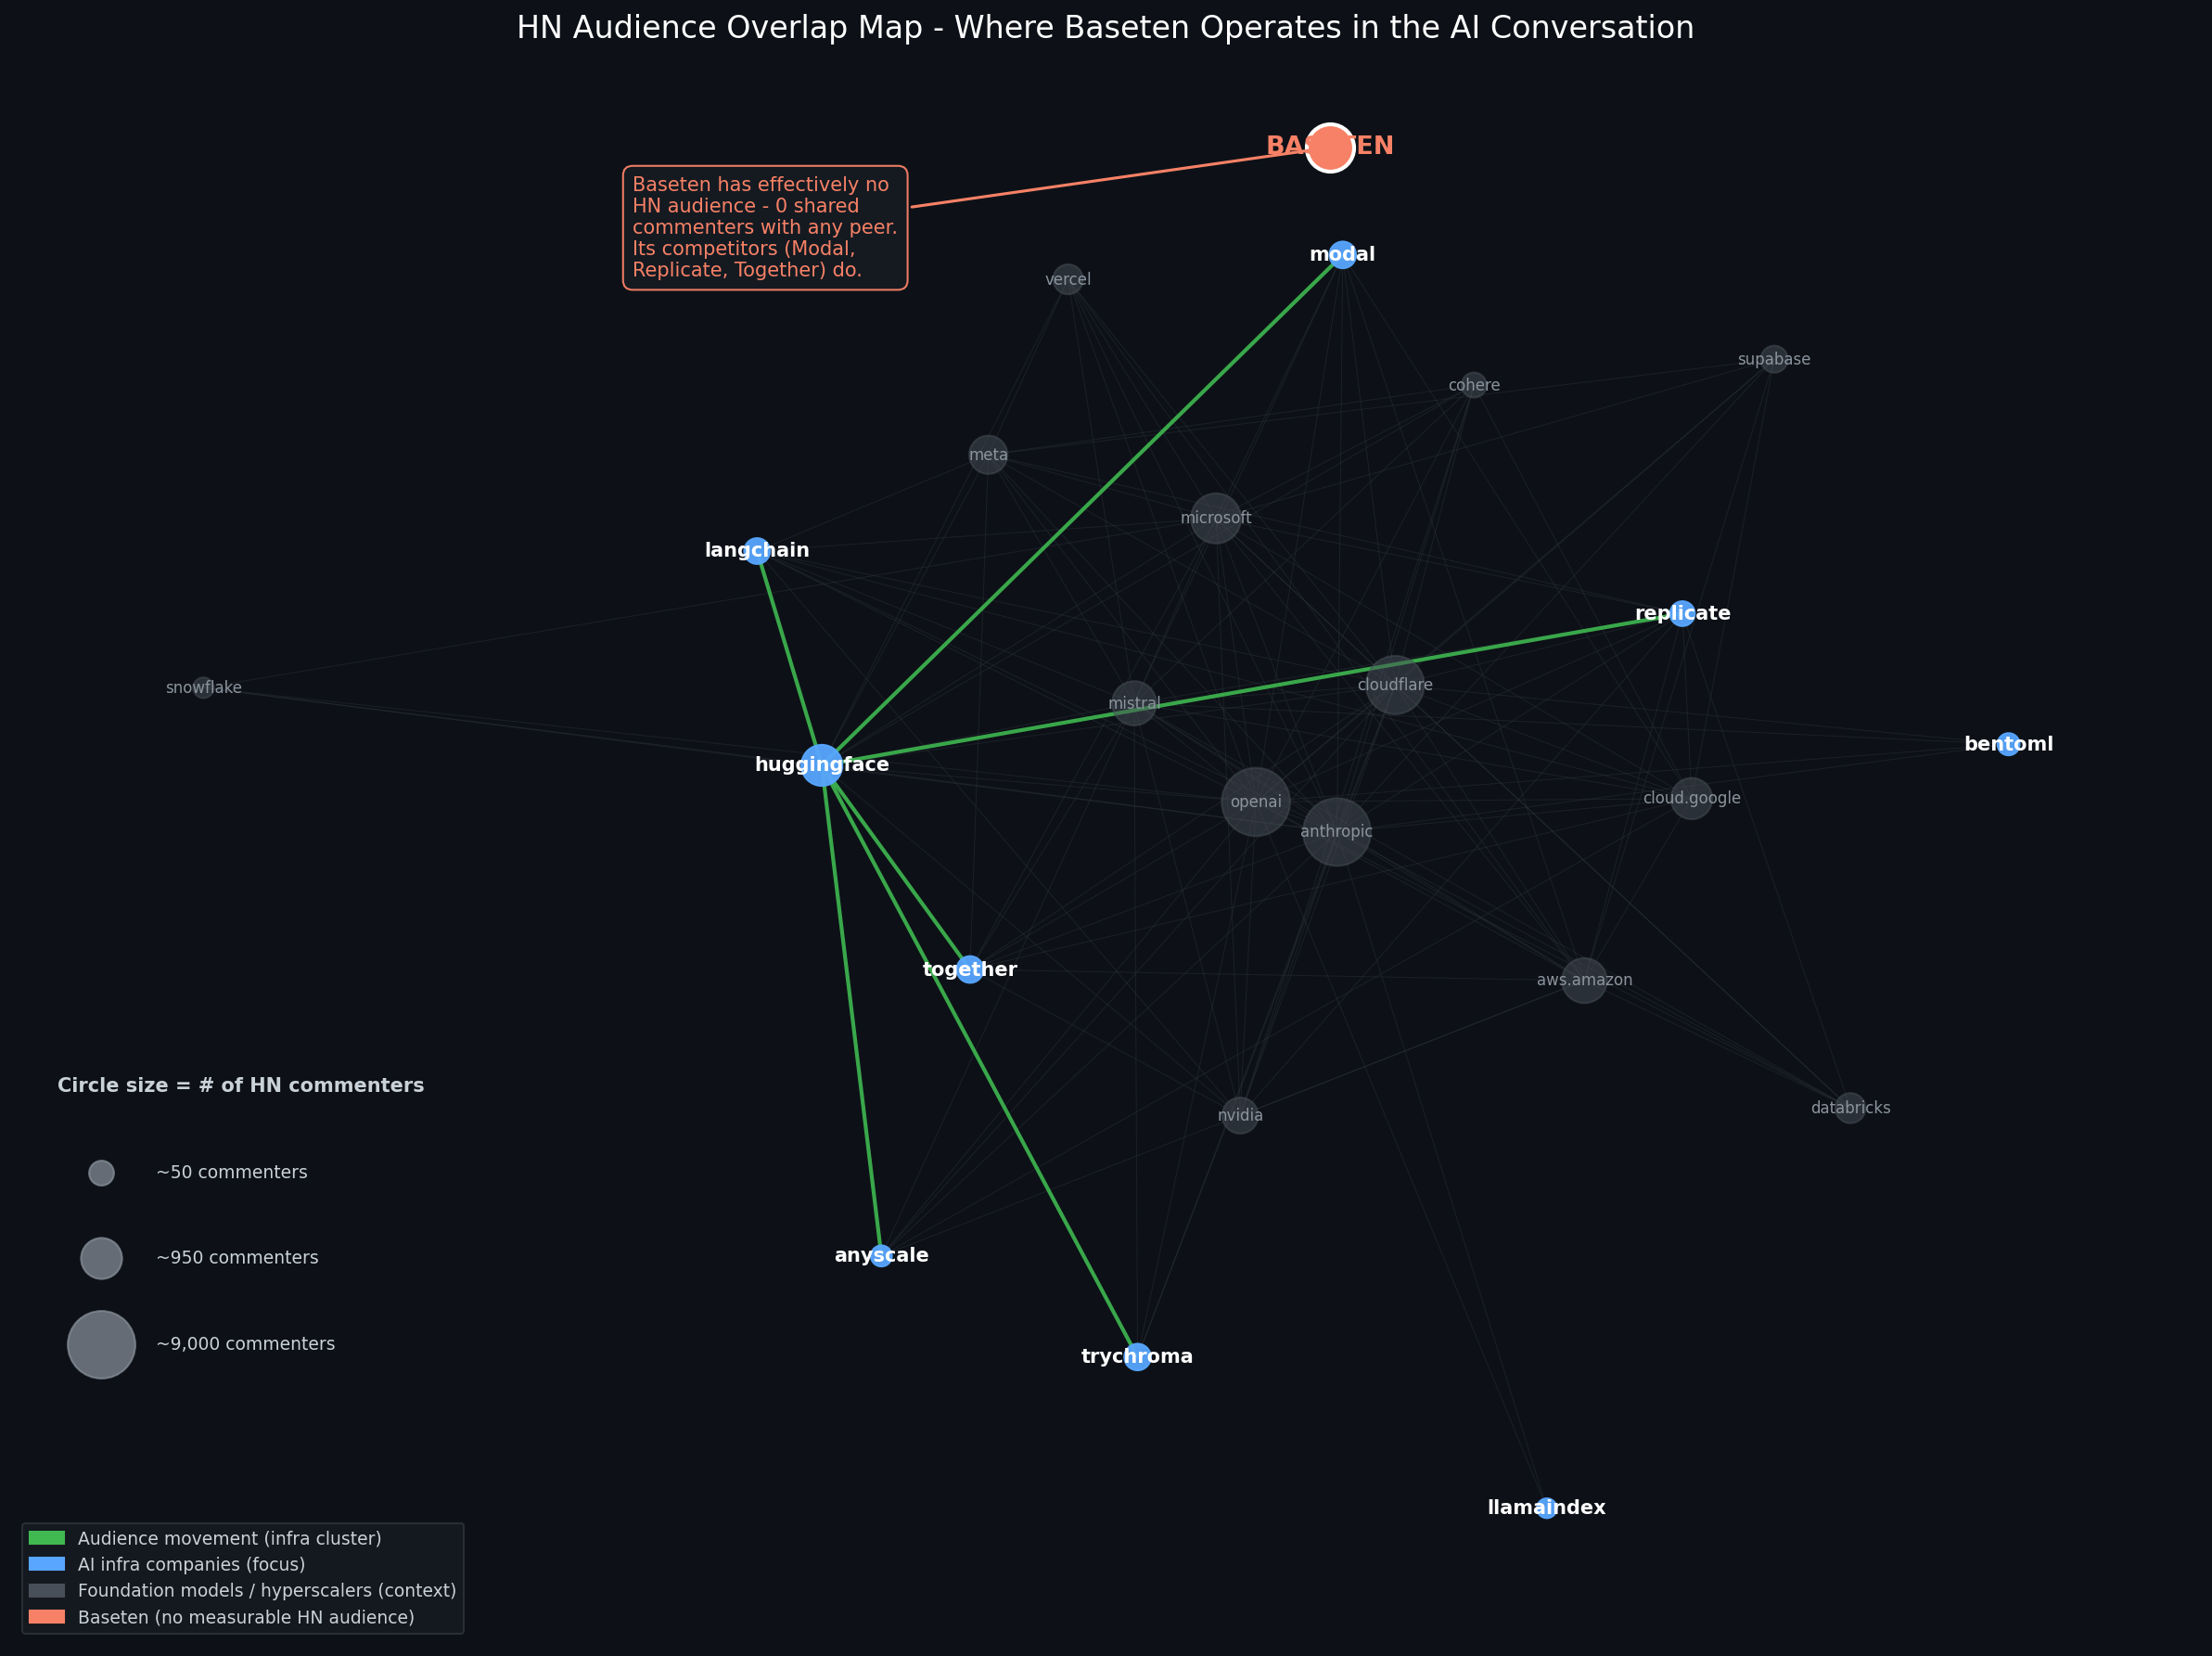
The result is a network map where companies are nodes and shared commenters are edges, indicating which competitors and adjacent tools share an audience. Useful before you decide where to spend…
This tutorial walks you through how to build the same thing for your own market. No coding background required. Plan on ~2 hours your first time through.
Who this is for
Digital, growth, and performance marketers who want a methodology for evaluating a new channel before they commit budget to it. If you've ever sat in a planning meeting and someone asked "Should we try Reddit / HN / Product Hunt / a new subreddit / X community?" and the answer was a vibe rather than data, this is for you.
You don't need to know how to code. You do need to be willing to copy and paste a few commands into a terminal window.
What you'll need
- A Mac or any computer (Windows works with minor adjustments)
- ~2 hours (the data pull runs in the background)
- A GitHub account (free)
- Python 3.9 or newer (free and quick install)
- A list of 20–40 companies (I ended with 31) you want to map (the GTM work, which is the most important step)
That's it. No paid tools, no API keys, no scraping. HN's API is open.
An aside on using AI for this
I built this with Claude as my coding pair. I'm a marketer, not an engineer. So I want to flag my opinion: marketers should be using AI as much as possible, but they should be driving the strategy, dictating the vision, and reviewing every step and the final output.
The AI is the leverage, the tool. You are the operator. Use the AI to write the code; don't outsource the thinking.
If you're following this tutorial: feel free to paste any of the code below into an LLM and ask "explain what this does" or "modify this to do X instead." That's exactly the workflow. Just make sure you can articulate the why at every step.
1. Pick your domains (this is the GTM work)
This is the single most important step. The map is only as good as the list you feed it. Spend more time here than you think you need.
The framework I use is four concentric rings around your anchor company:
- Ring 1: Direct competitors. Who does your sales team compete against (keep in mind the PMM and sales answer might vary)?
- Ring 2: Adjacent tooling. What the buyer uses alongside you. Their workflow.
- Ring 3: Upstream / dependencies. What sits beneath you in the stack.
- Ring 4: Broader peripheral context. Where the audience hangs out even when they're not talking about your category (think of casting a wider net for contextual targeting).
For a marketer evaluating a channel, the goal is range, not just direct competitors. If your map is only "us and our five competitors," you'll see a tight little cluster and miss the actual adjacency that tells you where the audience already lives.
Aim for 30–40 domains. Fewer than 20 = the map looks empty. More than 50 = the visual becomes unreadable.
A few practical rules for the list:
- Use root domains (
example.com), not subdomains - Lowercase everything
- Skip companies that don't have a clear web domain
- Be honest about including your own employer or anchor (if the absence is interesting, leave it in!)
Save your list in a Google Sheet with three columns: domain, ring, why it matters. The third column is for you, not the script. The approach forces you to articulate why each domain belongs.
2. Set up your environment
Open Terminal on your Mac (Cmd + Space, type terminal, hit Enter).
Check if you have Python:
python3 --versionIf you see Python 3.9.x or higher, you're set. If you get "command not found" or a pop-up asking to install developer tools, click Install and wait 5-10 minutes.
Then install the libraries we need:
pip3 install requests pandas networkx matplotlibCreate a GitHub repo for this project (https://github.com/new), then clone it locally:
cd ~/Documents
git clone https://github.com/YOUR_USERNAME/YOUR_REPO_NAME.git
cd YOUR_REPO_NAME
mkdir data
You now have an empty project folder. Time to fill it.
3. Pull the data
This script asks Hacker News's Algolia API for every story matching each of your domains over the last 12 months, then pulls every commenter on every one of those stories. Output is one JSON file with the raw data.
Create a file called fetch_hn_data.py and paste this in:
import requests
import json
import time
from urllib.parse import urlparse
from pathlib import Path

DOMAINS = [
    # Replace with your own list from Step 1
    "example1.com",
    "example2.com",
    "example3.com",
]

MONTHS_BACK = 12
SECONDS_PER_DAY = 86400
CUTOFF_TIMESTAMP = int(time.time()) - (MONTHS_BACK * 30 * SECONDS_PER_DAY)
HN_SEARCH_URL = "https://hn.algolia.com/api/v1/search_by_date"
SLEEP_BETWEEN_REQUESTS = 1
OUTPUT_DIR = Path("data")
OUTPUT_DIR.mkdir(exist_ok=True)

def url_matches_domain(url, domain):
    if not url:
        return False
    try:
        host = urlparse(url).netloc.lower()
    except Exception:
        return False
    return host == domain or host.endswith("." + domain)

def fetch_stories_for_domain(domain):
    stories, seen_urls = [], set()
    page, hits_per_page = 0, 100
    consecutive_empty_pages, MAX_EMPTY_PAGES = 0, 3
    while True:
        params = {
            "tags": "story",
            "numericFilters": f"created_at_i>{CUTOFF_TIMESTAMP}",
            "query": domain,
            "restrictSearchableAttributes": "url",
            "hitsPerPage": hits_per_page,
            "page": page,
        }
        try:
            response = requests.get(HN_SEARCH_URL, params=params, timeout=30)
            response.raise_for_status()
            data = response.json()
        except requests.RequestException:
            break
        hits = data.get("hits", [])
        if not hits:
            break
        matches = 0
        for hit in hits:
            url = hit.get("url", "") or ""
            if url_matches_domain(url, domain):
                url_lower = url.lower()
                if url_lower not in seen_urls:
                    seen_urls.add(url_lower)
                    stories.append({
                        "story_id": hit.get("objectID"),
                        "title": hit.get("title"),
                        "url": url,
                        "author": hit.get("author"),
                        "points": hit.get("points", 0),
                        "created_at": hit.get("created_at"),
                    })
                    matches += 1
        if matches == 0:
            consecutive_empty_pages += 1
            if consecutive_empty_pages >= MAX_EMPTY_PAGES:
                break
        else:
            consecutive_empty_pages = 0
        if len(hits) < hits_per_page or page > 30:
            break
        page += 1
        time.sleep(SLEEP_BETWEEN_REQUESTS)
    return stories

def fetch_commenters_for_story(story_id):
    url = f"https://hn.algolia.com/api/v1/items/{story_id}"
    try:
        response = requests.get(url, timeout=30)
        response.raise_for_status()
        data = response.json()
    except requests.RequestException:
        return set()
    commenters = set()
    def walk(node):
        if not node:
            return
        if node.get("author"):
            commenters.add(node["author"])
        for child in node.get("children", []):
            walk(child)
    walk(data)
    commenters.discard(data.get("author"))
    return commenters

def main():
    print(f"Pulling {len(DOMAINS)} domains, {MONTHS_BACK}-month window\n")
    results = {}
    for i, domain in enumerate(DOMAINS, 1):
        print(f"[{i}/{len(DOMAINS)}] {domain}")
        stories = fetch_stories_for_domain(domain)
        all_commenters = set()
        for story in stories:
            all_commenters.update(fetch_commenters_for_story(story["story_id"]))
            time.sleep(SLEEP_BETWEEN_REQUESTS)
        results[domain] = {
            "story_count": len(stories),
            "commenter_count": len(all_commenters),
            "commenters": sorted(all_commenters),
            "stories": stories,
        }
        print(f"  {len(stories)} stories, {len(all_commenters)} commenters\n")
    with open(OUTPUT_DIR / "hn_raw_data.json", "w") as f:
        json.dump(results, f, indent=2)
    print("Saved to data/hn_raw_data.json")

if __name__ == "__main__":
    main()
What this does, in plain English: for each domain in your list, it asks HN's API for every story published in the last 12 months that points to that domain. It dedupes resubmissions (HN allows the same URL to be submitted multiple times). Then, for each story, it walks the comment tree and collects every unique commenter. The output is a JSON file with story metadata + commenter lists per domain.
Run it:
python3 fetch_hn_data.pyThis will take 30-60 minutes for 30 domains. Some domains (OpenAI, AWS, Microsoft) have hundreds of HN stories each, and we're hitting the API once per story to get the comment thread. Walk away. The script prints progress as it goes. Don't worry. I have included a step to surface what really matters, so those behemoths don't take over the actual research.
One important quirk to know: HN's Algolia search treats your domain as a fuzzy query. If you search for replicate.com, you'll also get hits for page-replica.com and similar. The script filters those out by parsing the actual URL and matching the hostname. If you tune this code, don't break that filter, as false positives will pollute the rest of the analysis.
4. Compute the overlap matrix
Now we calculate how many commenters they share for every pair of domains. This is the math that turns "29,000 raw data points" into "Modal and Replicate share 26 commenters, which matters because when I did it, Modal only had 83 total."
Create compute_overlap.py:
import json
from pathlib import Path
from itertools import combinations

DATA_DIR = Path("data")
INPUT_FILE = DATA_DIR / "hn_raw_data.json"
OUTPUT_FILE = DATA_DIR / "overlap_matrix.json"

def main():
    with open(INPUT_FILE) as f:
        data = json.load(f)
    commenter_sets = {d: set(info["commenters"]) for d, info in data.items()}
    domains = list(commenter_sets.keys())
    edges = []
    for d1, d2 in combinations(domains, 2):
        set1, set2 = commenter_sets[d1], commenter_sets[d2]
        shared = set1 & set2
        if not shared:
            continue
        union = set1 | set2
        jaccard = len(shared) / len(union) if union else 0
        smaller = min(len(set1), len(set2))
        overlap_coef = len(shared) / smaller if smaller else 0
        edges.append({
            "source": d1, "target": d2,
            "shared_commenters": len(shared),
            "jaccard": round(jaccard, 4),
            "overlap_coefficient": round(overlap_coef, 4),
            "source_size": len(set1),
            "target_size": len(set2),
        })
    edges.sort(key=lambda x: x["shared_commenters"], reverse=True)
    nodes = [{
        "domain": d,
        "story_count": data[d]["story_count"],
        "commenter_count": data[d]["commenter_count"],
    } for d in domains]
    with open(OUTPUT_FILE, "w") as f:
        json.dump({"nodes": nodes, "edges": edges}, f, indent=2)
    print(f"Top overlaps:\n")
    for edge in edges[:15]:
        print(f"  {edge['source']:<20} <-> {edge['target']:<20} "
              f"{edge['shared_commenters']:>5} shared "
              f"(overlap coef: {edge['overlap_coefficient']:.3f})")

if __name__ == "__main__":
    main()
Two important things to understand here:
Jaccard similarity measures how much two audiences overlap relative to their combined size. It's the standard. But it has a flaw for this use case: when one domain has 10,000 commenters and another has 80, Jaccard will register very low even if every one of the smaller audience is also in the larger. That undersells real overlap.
Overlap coefficient divides shared commenters by the smaller set's size. This is much better when audience sizes vary by orders of magnitude, particularly when you're mapping an OpenAI scale company next to a Series B startup. We use this for the visualization.
Run it:
python3 compute_overlap.pyThis finishes in seconds. The terminal will print the top 15 strongest overlaps in your dataset. Read this carefully before moving on. It often surfaces interesting structures before you even see the visual, such as competitors who share audiences, those that seem isolated, and unexpected adjacencies.
5. Visualize
Create visualize_static.py, edit FOCUS_DOMAINS and ANCHOR_DOMAIN to match your own list, then run:
python3 visualize_static.py
open audience_map.png
You'll see a network where:
- Green lines = audience movement within your focus cluster
- Faint gray lines = connections to the broader context
- Blue circles = focus cluster (your competitors / adjacencies)
- Gray circles = the broader market context
- Orange circle = your anchor company
Circle size = total HN commenters (audience scale). Bigger circle, bigger audience.
6. Read the map
Three things to look at, in order:
1. Where does YOUR company sit? If your anchor is connected to several focus nodes by green lines, you're already showing up in the conversation. If it's isolated (like our anchor company in the example map), the absence is the finding: the audience exists adjacent to your competitors, but you're not in it.
2. Where's the gravitational hub? In most B2B markets, one or two nodes will have edges to almost everything else. That node is the room your audience is already in. If you're going to invest in earned presence on this channel, that's where the conversation routes through.
3. Which clusters separate? The map often reveals that what looks like one audience is actually two. In my example, the AI-infra companies clustered separately from the foundation-model giants. Same broad market, different rooms. That distinction has real implications for content strategy and paid targeting.
Caveats and how to make this better
Shared commenters approximate shared audience, not causal influence. A commenter showing up in two threads doesn't mean one company influenced the other. It means they read both. That's still useful, but it's correlation, not attribution.
Some commenters are probably the companies themselves. Engineers and founders comment on their own posts and sometimes on competitors'. The map slightly inflates the "audience overlap" relative to "internal team participation." For a deeper analysis, you could filter out known company employees (cross-reference HN usernames against LinkedIn/Twitter), but that's a v2 problem.
HN skews toward a specific persona. Developer-adjacent, technical, often US-centric. This is one signal, not the whole market. For a B2C consumer brand, this method has limited applicability. For B2B selling to engineers, data teams, DevOps, and security is directly relevant.
The time window matters. I started with 6 months, found that slower-posting companies vanished from the data entirely, and then expanded to 12 months. If your category includes high- and low-cadence posters in the same map, longer windows are usually better.
Edge thresholds are a choice, not a fact. I set MIN_OVERLAP_COEF = 0.10. The smaller of the two audiences has to share at least 10% of its commenters with the other for a line to be drawn. Lower the threshold → denser map. Raise it → cleaner clusters but you'll lose weaker signals. Tune it for your data!
Three real ways to use this on the job
1. Pre-spend channel audit. Before allocating budget to a new channel (Reddit, podcast sponsorships, newsletter buys, paid social interest targeting), run the audience map first (you can also request it from the AM or AE). If your buyer's adjacent communities aren't on that channel, you're paying to acquire the wrong audience. Map before you buy.
2. Competitive intel for ABM list-building. The companies most overlapping with yours on a given channel are often signaling shared ICP. Pull the top 10 overlapping domains from your overlap matrix and treat them as a research input for tier-1 account list refinement.
3. Earned-presence prioritization. The "hub" nodes I described in Step 6 are where the audience already congregates. For content programs, that's where you want to show up. Show HN launches, technical deep-dives, founder participation in adjacent threads. Cheaper than paid, higher signal, compounds over time.
What you have now
If you've made it through, you have:
- A working data pipeline that pulls any HN domain's audience
- A computed overlap matrix you can re-use for any analysis
- A custom network visualization for your specific market
- A defensible methodology for channel-fit conversations
Fork it, swap in your own domains, and ship something. The work travels.
Code, sample data, and the full analysis I built for an AI-infrastructure market are in this repo. Built with Python and Claude as a coding pair. Reach out if you have any questions or want to compare.